
Page 106 - Demo
P. 106
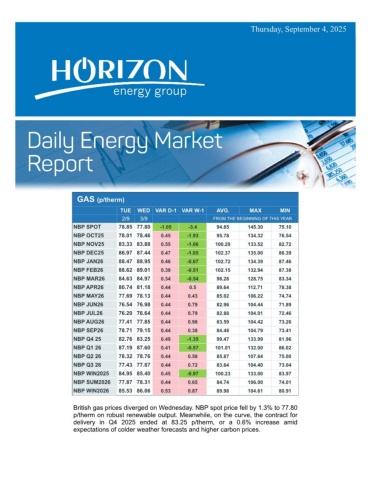
Monday, March 16, 2026GAS (p/therm) THUFRIVAR D-1 VAR W-1AVG.MAXMIN 12/313/3FROM THE BEGINNING OF THIS YEARNBP SPOT125.75 126.000.25-7.2593.56140.0071.25NBP APR26129.35 127.79-1.56-9.6385.26143.5364.52NBP MAY26127.63 126.07-1.56-8.182.99141.5063.61NBP JUN26123.51 122.14-1.37-5.1680.63135.0762.69NBP JUL26120.44 119.26-1.18-2.0578.92129.9562.36NBP AUG26120.24 119.87-0.37-0.1478.83128.9862.76NBP SEP26120.84 119.74-1.1-1.3579.76129.4264.03NBP OCT26120.00 118.19-1.81-1.1379.01127.6763.64NBP NOV26121.79 120.49-1.3-0.5382.27129.3767.58NBP DEC26123.64 122.19-1.45-1.4884.26131.7269.62NBP JAN27123.57 121.85-1.720.6285.52130.4071.31NBP FEB27122.75 120.44-2.311.6184.96128.4671.23NBP MAR27113.27 111.25-2.022.279.72118.7667.33NBP Q2 26126.84 125.34-1.5-7.6482.96140.0563.67NBP Q3 26120.50 119.62-0.88-1.1879.16129.4563.04NBP Q4 26121.81 120.29-1.52-1.0581.84129.5966.94NBP Q1 27119.77 117.76-2.011.4783.35125.7969.91NBP SUM2026123.65 122.47-1.18-4.3981.05134.7263.35NBP WIN2026120.80 119.04-1.760.282.59127.7168.41NBP SUM202783.0084.0012.8364.1689.6557.74NBP WIN202783.5084.300.84.569.6786.5365.81NBP SUM202860.3761.531.165.3155.0061.5352.62The British spot gas price edged 0.2% higher at 126 p/therm on Friday,supported by geopolitical tensions in the Middle East. Gains were tempered byincreased Norwegian deliveries and expectations that the heating season isnearing its end. On the forward curve, the Summer 2026 delivery contract fellby 1% to 122.47 p/therm as markets priced in US and French commitments tosecure LNG shipments in the Gulf.
