
Page 58 - Demo
P. 58
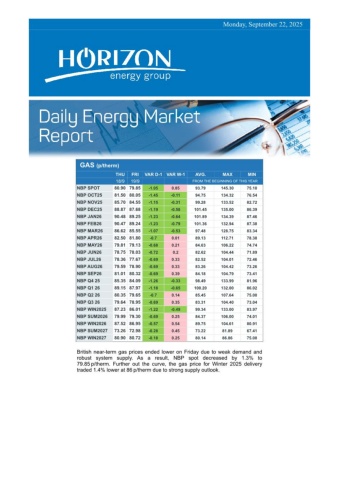
Wednesday, April 1, 2026GAS (p/therm) MONTUEVAR D-1 VAR W-1AVG.MAXMIN 30/331/3FROM THE BEGINNING OF THIS YEARNBP SPOT136.00 126.00-10-5101.26153.5071.25NBP MAY26138.46 128.10-10.36-8.3193.49155.9763.61NBP JUN26137.04 126.41-10.63-8.3891.11152.3562.69NBP JUL26135.67 125.38-10.29-7.4389.39149.8062.36NBP AUG26136.33 125.88-10.45-7.8789.40149.6562.76NBP SEP26137.47 127.18-10.29-7.8390.32150.1564.03NBP OCT26137.43 126.33-11.1-7.9189.62149.8863.64NBP NOV26140.73 130.68-10.05-6.8292.84152.5867.58NBP DEC26143.03 132.36-10.67-7.4794.85154.4869.62NBP JAN27144.33 134.01-10.32-6.6795.95153.6571.31NBP FEB27143.28 132.11-11.17-7.3595.19151.2071.23NBP MAR27133.93 123.02-10.91-7.4789.17141.4667.33NBP APR27115.30 107.48-7.82-5.8778.16120.7361.58NBP Q3 26136.48 126.14-10.34-7.789.70149.8663.04NBP Q4 26140.39 129.78-10.61-7.4192.43152.3166.94NBP Q1 27140.42 129.63-10.79-7.1693.38148.6969.91NBP Q2 27104.6698.30-6.36-4.5872.44110.4758.95NBP WIN2026140.41 129.71-10.7-7.2892.90150.5268.41NBP SUM2027102.5396.32-6.21-4.3970.66107.1657.74NBP WIN2027100.8896.00-4.88-3.7474.94105.3765.81NBP SUM202871.3369.55-1.78-0.6357.5773.0952.62NBP WIN202874.4874.13-0.35-0.8365.2576.6561.00A combination of bearish fundamentals weighed heavily on UK gas prices onTuesday, driven by a more favourable weather outlook pointing to a mild April,expectations for the start of the injection season, and strong LNG inflowsacross Europe, currently about 10% above last year’s levels. Hence, the NBPspot contract slumped by 7.4% to 126 p/therm, while the Winter 2026 deliverycontract tumbled by 7.6% to 129.71 p/therm.
