
Page 77 - Demo
P. 77
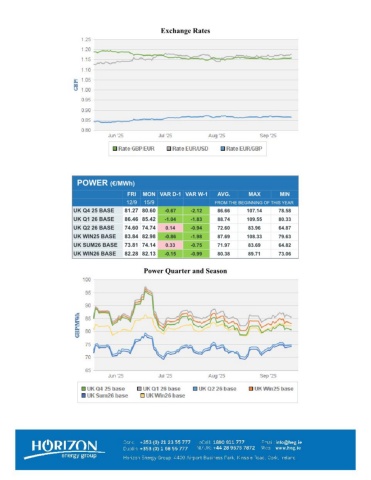
Exchange RatesPOWER (€/MWh) WEDTHUVAR D-1 VAR W-1AVG.MAXMIN 25/326/3FROM THE BEGINNING OF THIS YEARUK Q2 26 BASE98.95 102.493.54-7.1680.13109.6564.97UK Q3 26 BASE99.48 102.973.49-5.1279.38108.0965.36UK Q4 26 BASE100.92 106.085.16-3.8181.80109.8969.88UK SUM26 BASE99.22 102.733.51-6.1479.75108.8765.17UK WIN26 BASE102.70 107.815.11-4.7383.55112.5471.62UK SUM27 BASE77.0079.242.24-2.6966.9181.9359.74Power Quarter and Season
