
Page 26 - Demo
P. 26
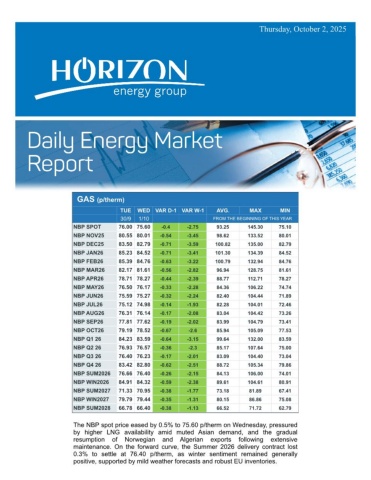
Wednesday, April 15, 2026GAS (p/therm) MONTUEVAR D-1 VAR W-1AVG.MAXMIN 13/414/4FROM THE BEGINNING OF THIS YEARNBP SPOT117.40 108.30-9.1-24.5103.68153.5071.25NBP MAY26116.79 108.75-8.04-26.2596.74155.9763.61NBP JUN26114.32 106.59-7.73-26.6194.43152.3562.69NBP JUL26112.60 104.79-7.81-26.892.74149.8062.36NBP AUG26112.62 105.06-7.56-27.2592.81149.6562.76NBP SEP26113.50 106.02-7.48-26.8293.73150.1564.03NBP OCT26112.65 105.42-7.23-27.193.04149.8863.64NBP NOV26116.05 108.82-7.23-27.1596.31152.5867.58NBP DEC26117.75 110.57-7.18-27.0598.27154.4869.62NBP JAN27118.35 110.70-7.65-27.6699.34153.6571.31NBP FEB27117.33 109.71-7.62-27.5698.52151.2071.23NBP MAR27107.49 100.31-7.18-27.1292.05141.4667.33NBP APR2794.8489.30-5.54-20.4380.79120.7361.58NBP Q3 26112.90 105.28-7.62-26.9693.08149.8663.04NBP Q4 26115.48 108.26-7.22-27.195.87152.3166.94NBP Q1 27114.29 106.81-7.48-27.4596.57148.6969.91NBP Q2 2787.2483.04-4.2-16.5174.74110.4758.95NBP WIN2026114.89 107.55-7.34-27.2796.22150.5268.41NBP SUM202784.8981.02-3.87-16.0672.91107.1657.74NBP WIN202784.5881.20-3.38-14.5776.62105.3765.81NBP SUM202863.7462.69-1.05-6.1358.5473.0952.62NBP WIN202870.5969.10-1.49-5.9866.0276.6561.00The NBP spot contract slumped by 8% to 108.30 p/therm on Tuesday,pressured by reports of a possible second round of peace talks betweenWashington and Tehran. On the forward curve, the Winter 2026 deliverycontract dipped by 6.4% to 107.55 p/therm as warmer-than-usual temperaturesare expected to limit demand and facilitate storage injections ahead of winter.
