
Page 10 - Demo
P. 10
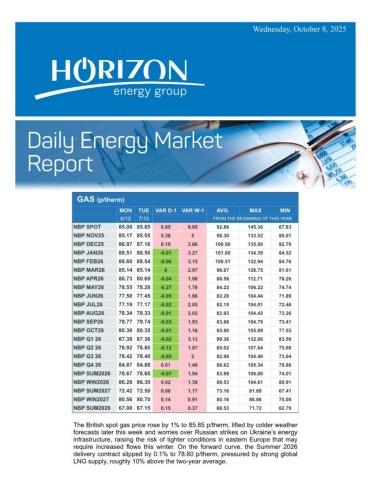
Tuesday, April 21, 2026GAS (p/therm) FRIMONVAR D-1 VAR W-1AVG.MAXMIN 17/420/4FROM THE BEGINNING OF THIS YEARNBP SPOT98.50101.252.75-16.15103.53153.5071.25NBP MAY2697.11101.314.2-15.4897.02155.9763.61NBP JUN2695.1099.134.03-15.1994.73152.3562.69NBP JUL2693.6597.393.74-15.2193.04149.8062.36NBP AUG2694.4397.723.29-14.993.14149.6562.76NBP SEP2695.7898.772.99-14.7394.07150.1564.03NBP OCT2695.6898.723.04-13.9393.40149.8863.64NBP NOV2699.98102.742.76-13.3196.71152.5867.58NBP DEC26101.90 104.552.65-13.298.66154.4869.62NBP JAN27102.66 105.462.8-12.8999.72153.6571.31NBP FEB27101.88 104.532.65-12.898.89151.2071.23NBP MAR2793.3796.543.17-10.9592.30141.4667.33NBP APR2785.2887.141.86-7.781.15120.7361.58NBP Q3 2694.6197.953.34-14.9593.41149.8663.04NBP Q4 2699.18102.002.82-13.4896.25152.3166.94NBP Q1 2799.22102.102.88-12.1996.91148.6969.91NBP Q2 2779.8881.681.8-5.5675.12110.4758.95NBP WIN202699.20102.052.85-12.8496.58150.5268.41NBP SUM202777.9979.751.76-5.1473.28107.1657.74NBP WIN202779.5581.131.58-3.4576.85105.3765.81NBP SUM202861.9563.391.44-0.3558.7773.0952.62NBP WIN202868.6869.881.2-0.7166.2076.6561.00UK gas prices increased on Monday, after Iran said the Strait of Hormuz hadbeen closed again, dampening expectations for LNG flows. Some of the 15LNG tankers briefly advanced towards the key route but later withdrew. Withthe ceasefire set to expire on Wednesday, the NBP spot contract soared bynearly 3% to 101.25 p/therm, while the Winter 2026 delivery contract advancedby 3% to 102.05 p/therm.
