
Page 14 - Demo
P. 14
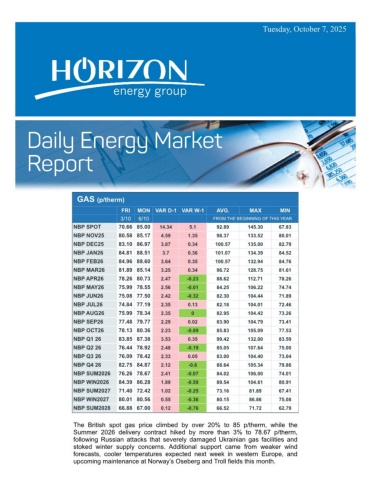
Monday, April 20, 2026GAS (p/therm) THUFRIVAR D-1 VAR W-1AVG.MAXMIN 16/417/4FROM THE BEGINNING OF THIS YEARNBP SPOT105.5098.50-7-13.5103.55153.5071.25NBP MAY26106.3097.11-9.19-12.5896.96155.9763.61NBP JUN26104.4795.10-9.37-12.9294.67152.3562.69NBP JUL26102.9193.65-9.26-12.8892.99149.8062.36NBP AUG26103.5594.43-9.12-12.393.08149.6562.76NBP SEP26104.6695.78-8.88-11.9994.00150.1564.03NBP OCT26104.1695.68-8.48-11.993.33149.8863.64NBP NOV26107.9399.98-7.95-11.196.63152.5867.58NBP DEC26109.79 101.90-7.89-10.9498.59154.4869.62NBP JAN27110.51 102.66-7.85-11.0299.64153.6571.31NBP FEB27109.62 101.88-7.74-10.7898.82151.2071.23NBP MAR27100.3293.37-6.95-9.4592.25141.4667.33NBP APR2790.4185.28-5.13-6.6481.07120.7361.58NBP Q3 26103.7094.61-9.09-12.3993.35149.8663.04NBP Q4 26107.2999.18-8.11-11.3196.18152.3166.94NBP Q1 27106.7299.22-7.5-10.496.84148.6969.91NBP Q2 2784.4679.88-4.58-4.5475.03110.4758.95NBP WIN2026107.0199.20-7.81-10.8696.50150.5268.41NBP SUM202782.3977.99-4.4-4.273.19107.1657.74NBP WIN202782.8879.55-3.33-2.4876.79105.3765.81NBP SUM202864.0161.95-2.06-0.858.7173.0952.62NBP WIN202870.0268.68-1.34-1.3266.1576.6561.00British gas prices fell to a seven-week low as news of the Strait of Hormuzreopening to commercial shipping improved supply expectations, thoughtraders remained cautious. Further declines are possible if stranded LNGcargoes begin moving or if QatarEnergy updates on the restart of Ras Laffan.The NBP spot contract lost 6.6% to 98.50 p/therm, while the Winter 2026delivery contract slumped by 7.3% to 99.20 p/therm.
